
How to Read a Basic Weather Satellite Image
A weather satellite image becomes easier to read when you identify the product before interpreting the pattern. Start with four checks: which channel is shown, when the image was made, what area it covers, and
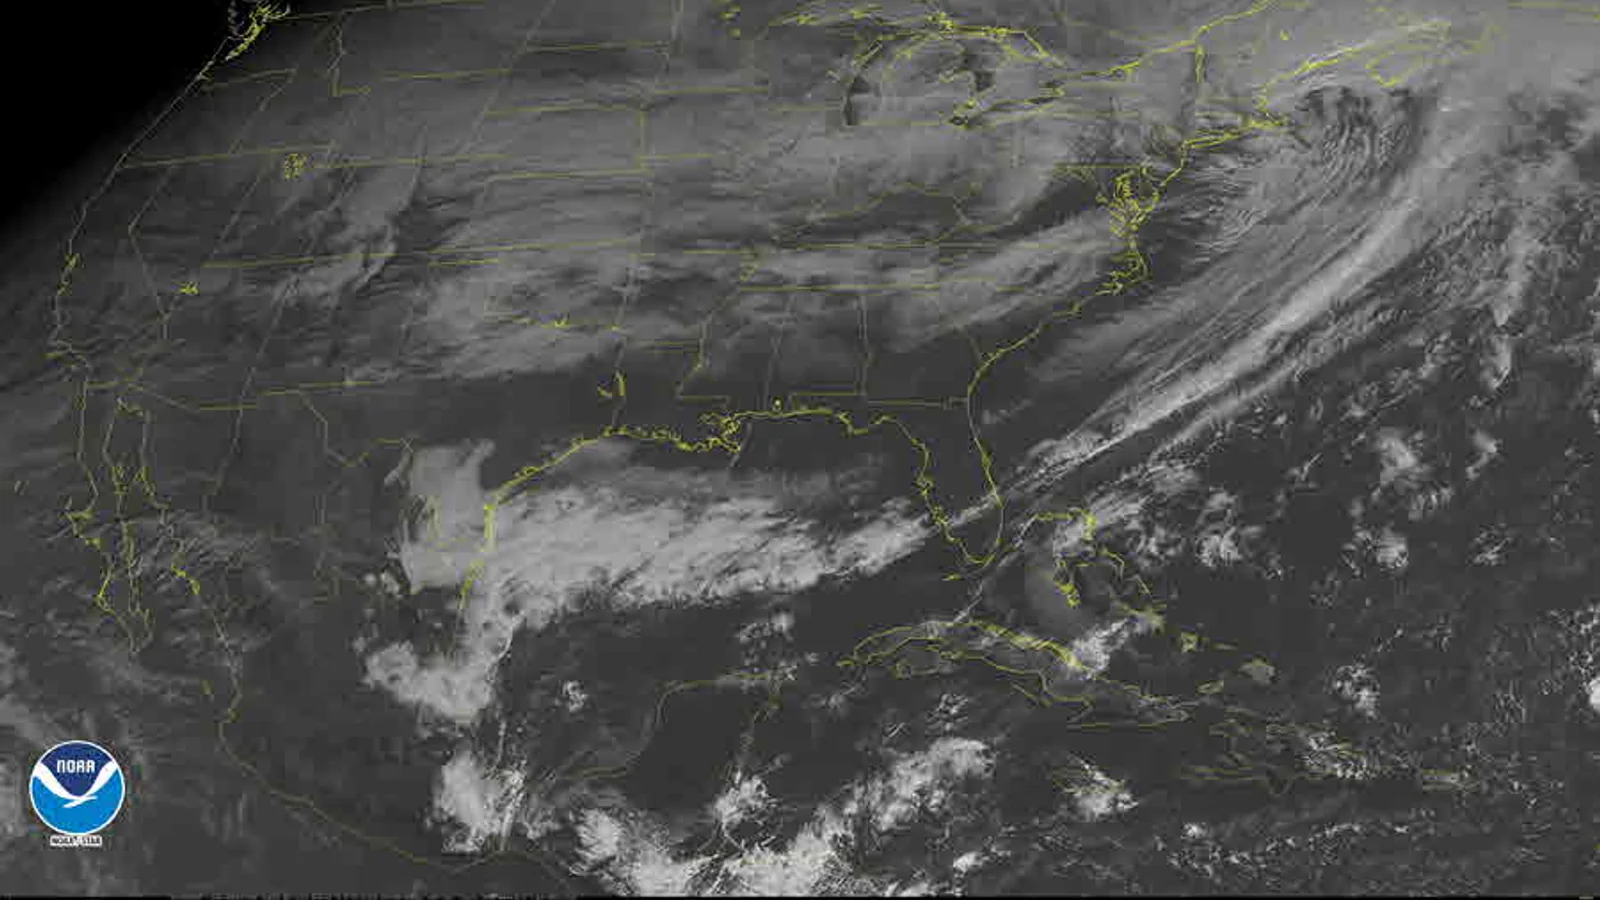
A weather satellite image becomes easier to read when you identify the product before interpreting the pattern. Start with four checks: which channel is shown, when the image was made, what area it covers, and whether it is an observation or a forecast layer. Only then describe cloud shape or movement. A satellite image can show where clouds were observed; it is not a direct measurement of rainfall at your house and it is not an official warning.
Start with the product label
Look for the provider, channel, timestamp, time zone, geographic extent, and legend. A loop may display several frames, but the screen can make them feel like one continuous present. Write down the time of the frame you are discussing. If the page shows local time, record that; if it shows UTC, keep UTC in your note and add your local conversion separately.
Also ask whether the layer is an observation or a model product. The Met Office explains that satellite observations are not a forecast model: they show where clouds were across the globe at a given time. The same page distinguishes observed rainfall radar from forecast layers. The label is not decoration; it determines what question the image can answer.
For this article, the useful comparison is a same-time visible image and infrared image, followed by one cautious comparison with what an observer recorded at the surface. You do not need to identify every cloud genus. You do need to preserve the channel and time so that your description remains checkable.
Make a short header for the image before writing any interpretation: “Provider — product/channel — frame time — time zone — coverage — legend checked.” For example, “NOAA — infrared — 10:20 UTC — western Atlantic sector — palette checked.” If the page supplies an image time but not a time zone, keep the original label and write “zone not shown.” Do not silently convert a time that you cannot identify.
This header also protects against a common comparison error. Two images may look similar while representing different channels, different contrast settings, or different parts of the day. A cloud band that appears to move may actually be a change in the displayed area or a jump between non-consecutive frames. The header will not solve every product problem, but it makes the remaining uncertainty visible.
Read visible imagery
Visible imagery is based on reflected sunlight. In a simple view, clouds often look bright against darker land or water, but brightness is not a universal “rain amount” scale. Sun angle, viewing angle, surface reflectivity, shadows, image processing, and cloud thickness all affect appearance.
The day-night limitation is especially important. The Met Office’s visible-composite explanation says that the satellite uses the visible part of the electromagnetic spectrum and cannot capture cloud images during the night; the image fades at dawn or dusk. A dark or empty-looking part of a visible image may therefore be in darkness, not clear of cloud.
NOAA/NESDIS describes the same distinction for GOES imagery: its visible band supplies daytime observations, while an infrared window supports cloud-feature identification day and night. Use this description when explaining why a nighttime visible image cannot answer the infrared question.
Use visible imagery for questions such as:
- Where are the broad bright cloud areas in this frame?
- Is a boundary or band changing position between frames?
- Which land or water features help orient the image?
Do not write “the brightest area has the heaviest rain” unless the specific product documentation supports that interpretation. Visible brightness is an image signal, not a rain gauge.
Read infrared imagery
Infrared imagery senses emitted heat rather than reflected daylight. That makes it useful at night as well as during the day. A temperature-enhanced infrared palette may make some cloud tops appear very bright or very dark, but the colors only have meaning with the legend and product description beside them.
Use language such as “a colder-looking cloud-top signal in this palette” rather than treating a color as a direct measurement of rainfall, wind, or surface temperature. The Met Office overview of satellite observations lists visible and infrared imagery among tools used to monitor cloud movement and other atmospheric features. It does not turn a single screenshot into a local forecast.
Before you compare two infrared images, check whether the palette, contrast, and timestamp are the same. A change in display settings can look like a change in the atmosphere. If the legend is missing, record “palette not verified” and limit the observation to location, shape, and movement that remain visible without the color interpretation.
Treat the legend as part of the measurement story. It may show temperature ranges, brightness categories, or an enhancement designed to make a particular feature stand out. Those labels are not interchangeable. If an image uses a color table that runs from dark blue to white, “white” is a visual category until the legend tells you what physical quantity the color represents. A good note can therefore contain both a description (“the band is bright in this palette”) and a qualified interpretation (“the legend associates the brighter values with colder cloud-top signals”).
When a product offers several channels, do not choose the one that best matches your preferred explanation after the fact. Record the channel first, then describe what it shows. If the surface note and the satellite view disagree, preserve the disagreement and look for a scale, time, viewing-angle, or obstruction explanation. A mismatch is a prompt for a narrower question, not permission to select the most dramatic image.
Use the image as a moving observation
An animation can help you describe movement, but it also introduces a sampling problem: frames are separated in time, and the satellite sees a broad area from above. Start with three frames rather than a dramatic conclusion. Record frame times, then describe the feature’s approximate direction of movement on the image.
The viewing geometry depends on the satellite. NOAA’s GOES-R information explains that geostationary satellites orbit above the equator and maintain coverage over specific regions. NOAA’s weather-satellite guide describes the different coverage and revisit characteristics of geostationary and polar-orbiting systems. A geostationary loop can show frequent movement over its coverage area; a polar-orbiting image may offer different detail and timing. Neither view is a universal, simultaneous camera of the whole atmosphere.
Use a movement note with four parts:
- Frame times: for example, 09:00, 09:10, and 09:20 UTC.
- Feature: a cloud band, open slot, or boundary that can be followed across all three frames.
- Direction on the map: describe the image movement, then avoid translating it into a surface wind direction without a source that supports that inference.
- Coverage limit: state which area is outside the frame or hidden by the image edge.
Compare one image with one ground note
The article’s useful deliverable is a matched record, not a verdict. Imagine a visible image at 10:00 UTC showing a broad cloud band west of a town, with the band’s eastern edge nearer the town at 10:20. A surface observer at 10:15 records “cloudy from the west-facing window; no rain seen; upper sky partly blocked by a roof.”
Write the comparison like this:
| Field | Matched note |
|---|---|
| Satellite product | Visible composite; provider and legend recorded |
| Image time | 10:00 and 10:20 UTC frames |
| Image observation | Cloud band’s eastern edge appears closer to the town in the later frame |
| Surface note | Cloudy from a west-facing window at 10:15; no rain seen; upper sky partly blocked |
| Agreement | Both records support cloud presence in the broad area |
| Non-claim | The pair does not establish rainfall at the observer’s exact location, cloud base, or a warning-level threat |
The difference is not a failure. The satellite sees a large, overhead scene, while the observer sees one local angle through a limited view. The Met Office observations network lists surface elements such as wind, rainfall, temperature, cloud, and visibility as distinct observations. Keeping the two records distinct helps you compare evidence without pretending that one replaces the other.
What the image cannot establish
Do not use a basic satellite image alone to claim any of the following:
- exact rainfall at your home;
- cloud base or visibility at the ground;
- a precise surface wind speed or direction;
- the timing or severity of a local hazard;
- an official warning or an instruction to take protective action.
For radar-specific questions, follow How to Read a Basic Weather Radar. The separate cwo-18 article will own the metadata checks that should happen before any map interpretation. For cloud observations made without imagery, use What Makes a Useful Cloud Observation?.
If the question is urgent or safety-related, leave the educational comparison and consult the official forecast and warning service for the relevant location. Satellite imagery is valuable evidence, but it is one observing product with a channel, time, coverage, and uncertainty—not a substitute for the authority responsible for warnings.
That habit—label first, interpret second—also makes your notes easier to revisit when a product page changes. Preserve the original frame time and provider even if the interface later uses a different color scheme or layout.