Why Your Backyard Weather Differs from the Forecast
A forecast and a backyard observation can both be reasonable while showing different conditions. They answer different questions. Your notebook describes what one sensor or observer found at one exposed point a
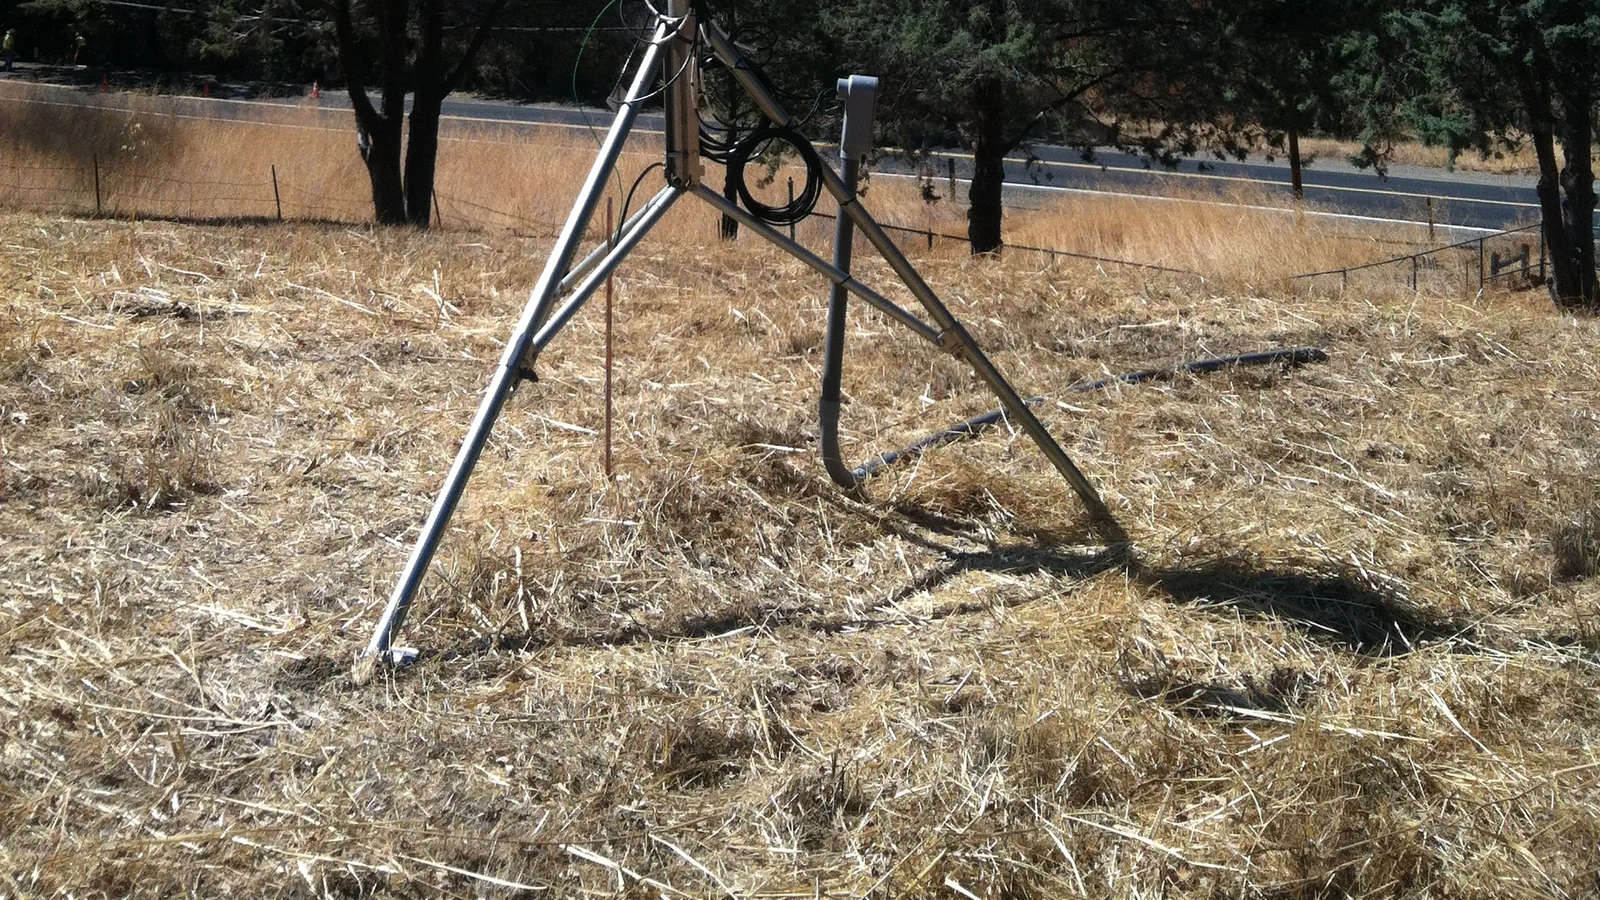
A forecast and a backyard observation can both be reasonable while showing different conditions. They answer different questions. Your notebook describes what one sensor or observer found at one exposed point and time. A public forecast describes expected conditions for a stated area and period. Treating them as identical measurements creates most apparent contradictions in everyday comparisons.
That does not mean forecasts are beyond question, or that a home observation is unimportant. It means a fair comparison begins by matching the thing being compared.
A point is not an area
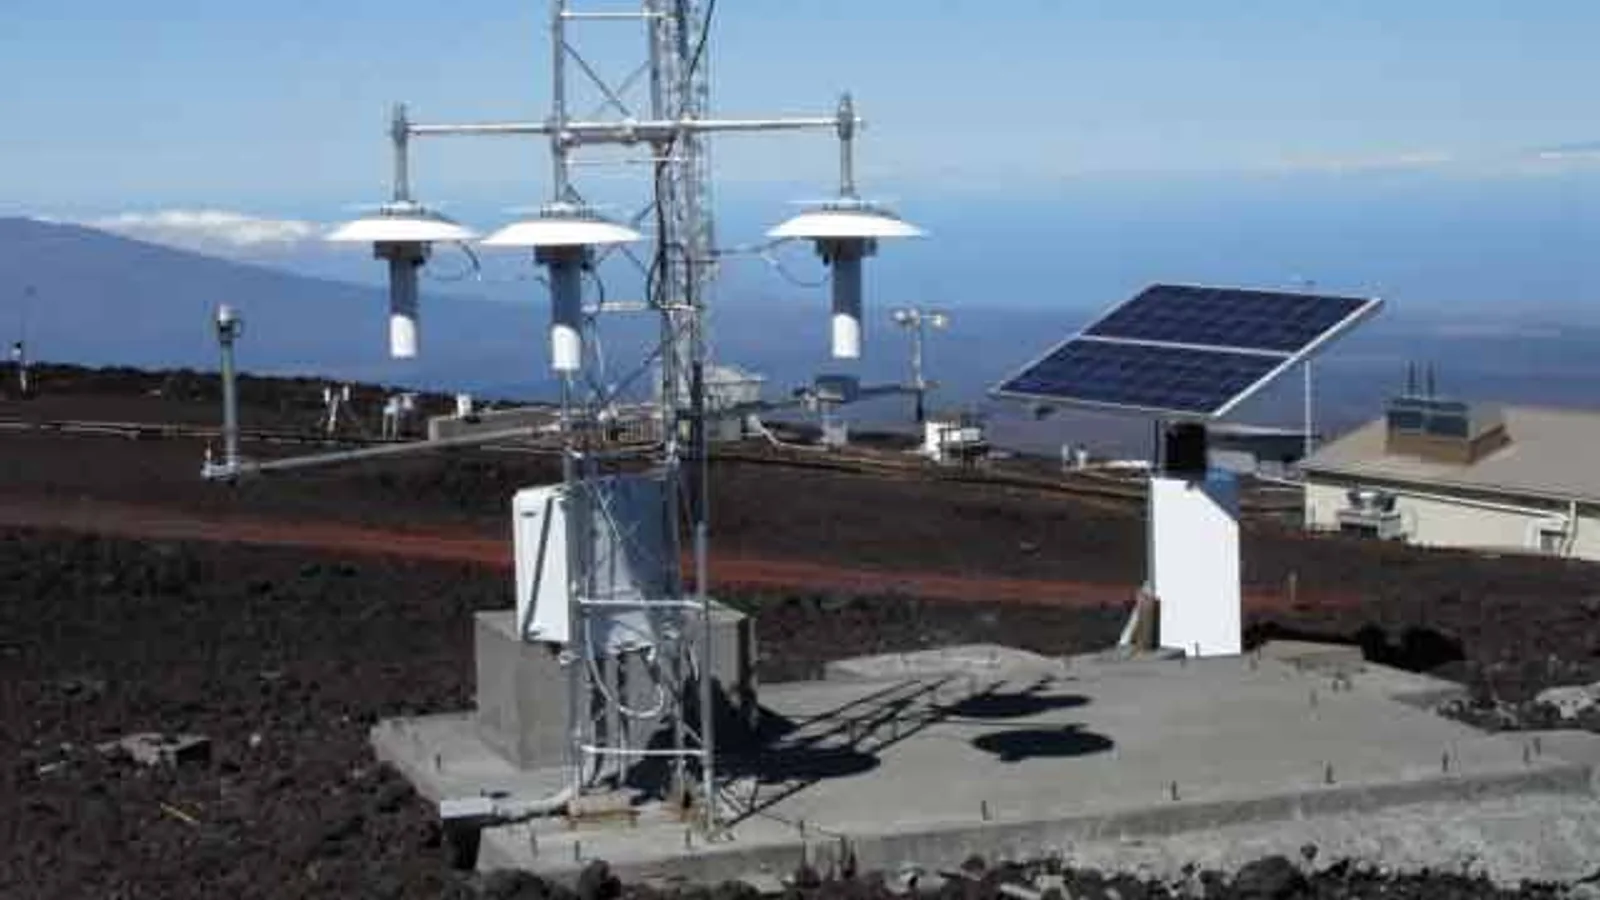
Your thermometer may sit beside grass, paving, a wall, a balcony, a hedge, or an air-conditioning outlet. Each setting can affect what the sensor encounters. An observer standing in a sheltered garden can also experience a different wind from an observer in an open field a short distance away.
Official observing networks document exposure because it matters. The Met Office notes that standard sites must meet WMO exposure requirements; its network guidance describes undesirable influences such as buildings warming temperature measurements and trees sheltering wind. Those statements do not make a home station useless. They explain why its site description belongs next to its data.
A forecast has its own scale and clock
The U.S. National Weather Service documents many point forecasts as forecasts produced on grids of about 2.5 km by 2.5 km. That is not a universal resolution, and it is not a promise that every yard in the grid will report the same value at every minute. Other services use their own models, grids, update cycles, and ways of presenting uncertainty.
Time matters just as much. A forecast labelled for an afternoon can be compared poorly with a sensor reading at 13:07 if the forecast is intended to summarize a longer period. Before calling values different, write the forecast source, issue time, valid period, unit, and your observation time.
Work through a fair comparison
Suppose a forecast says “cloudy, 13 °C” for the morning. At 07:35, your shaded north-wall sensor reads 14.2 °C and you see blue gaps. Neither statement automatically disproves the other.
Start with four checks:
- Was the forecast valid for 07:35 or for a broader period?
- Is the sensor shaded, ventilated, and away from warm surfaces?
- Does “cloudy” mean complete overcast, or a broader expected condition for the period?
- Are you comparing the same temperature unit and the same local time?
Your journal can then say: “Forecast checked at 07:20: cloudy, 13 °C for morning period. At 07:35, sensor at shaded north wall read 14.2 °C; blue gaps visible. Comparison limited by point exposure and differing time scale.” That is a useful result because it preserves context rather than assigning blame.
The strongest objection
A large, repeated difference can deserve investigation. A sensor consistently reading far above nearby official observations may be in sun, near a warm surface, poorly ventilated, or using an incorrect unit. A forecast may also miss a local feature or require an update. The correct response is not “the forecast is always wrong” or “my station is always wrong.” It is to check the observation setup, timing, and official updates.
The NWS describes forecasting as analysis of many observations, including surface reports, satellite imagery, radar, upper-air data and aircraft observations. A backyard record adds one local perspective; it cannot reproduce the full analysis. Conversely, a forecast does not erase what a correctly documented observer experienced at a particular site.
Improve the observation before judging it
The fastest improvement is usually metadata, not a new device. Record where the sensor is mounted, its height, nearby surfaces, whether direct sun reached it, and whether a wall or tree blocks airflow. Record changes to that setting as well. A sensor moved from a patio table to a shaded grass site has not produced a directly comparable continuation of the same series.
When comparing cloud cover, use the same restraint. A view framed by buildings may contain blue gaps that a broader forecast still reasonably describes as cloudy. Note the sector you could see and avoid translating a single window view into a claim about an entire district.
Repeat the comparison on several days before searching for a pattern. Keep the raw notes even when they disagree with your first impression. A useful monthly review may reveal that the largest differences occurred after direct sunlight reached the sensor, on calm mornings, or when readings were taken outside the forecast’s stated period. Those are hypotheses about the record, not conclusions about the whole atmosphere or a forecast service.
Keep the boundary useful
Use personal observations to learn about your site, improve its metadata, and ask better questions. Use official forecasts to plan for expected conditions. Use official warnings and emergency instructions when hazards are involved.
The conclusion would change only if the observation and forecast were genuinely matched in place, time, exposure, definition, and uncertainty, yet still showed a meaningful persistent discrepancy. Even then, the next step is careful verification, not a public warning or a personal forecast service.